Glossary and KPIs
A KPI is a number your organisation steers on, such as net sales, defined once. A metric is how one model calculates a number: a Power BI measure, a dbt metric, a SQL expression. One KPI can have metrics in several models. The glossary is where your organisation keeps its definitions: its KPIs, plus the concepts they count, the segments those split into and the systems the data comes from.
Pick your KPIs
Section titled “Pick your KPIs”After a model is read, its Overview asks Which of these are your KPIs?. You need the Contributor role.
- Tick the metrics that are KPIs. Choose Not a KPI to drop one from the list.
- Choose Add as KPIs.
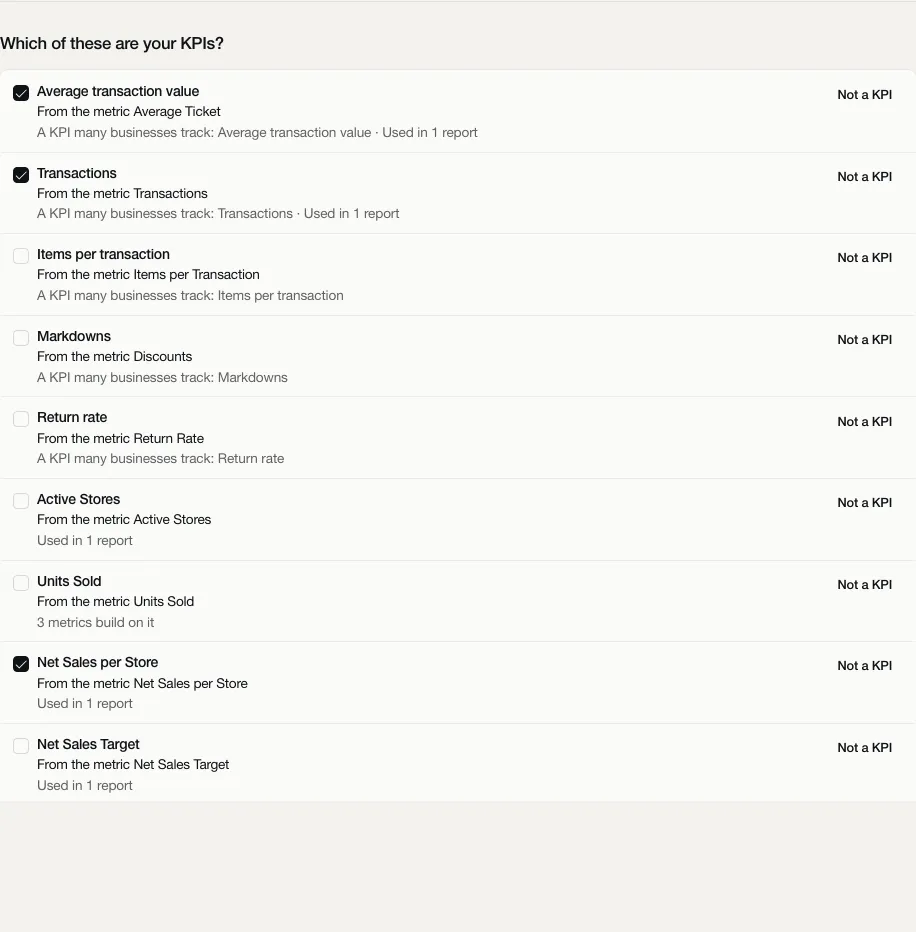
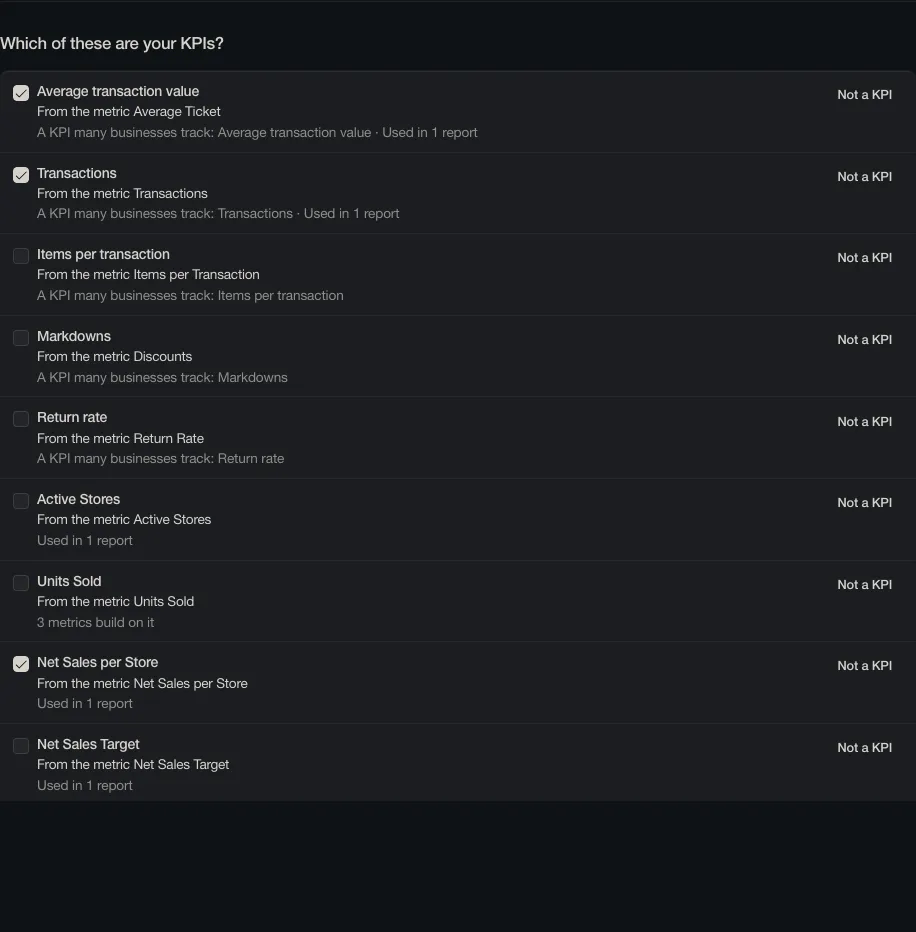
They are added as drafts. The guided start’s step Add KPIs leads here too.
With models read, an empty Glossary first offers See what your models compute: Across models lists the KPIs your models already compute, with several definitions of one side by side, to add as drafts.
You can also start from a template for your sector: Start from a template on an empty Glossary, or Add from a template in its … menu later. It adds a sector’s usual KPIs, concepts and segments as drafts, each marked as a KPI many businesses track. Review each one and delete what doesn’t apply.
Read and review
Section titled “Read and review”Glossary is one page for everyone. It has a tab for KPIs, Concepts and Systems, each with its count. Every item is a row with its name and definition. A KPI also shows its unit, VAT basis and the concepts it is about; a concept, the segments it splits into. Filter a tab by Reviewed or Draft, or on Formulas differ among the KPIs, and by name. Click a row to open it: its note, the metrics per model, its segments, its links to other items and where it came from. Click it again to close it.
A segment is what a concept splits into, so numbers can be grouped by it. A sale splits by sales channel into the counter, vending and online; online splits again into the own website and the delivery platforms. A store splits into own and franchise stores. Contributors add one with + next to Segments in the concept’s row, and change one by choosing it. A segment under another has that one’s concept. Open questions and Across models (for contributors and up) sit next to Glossary at the top.
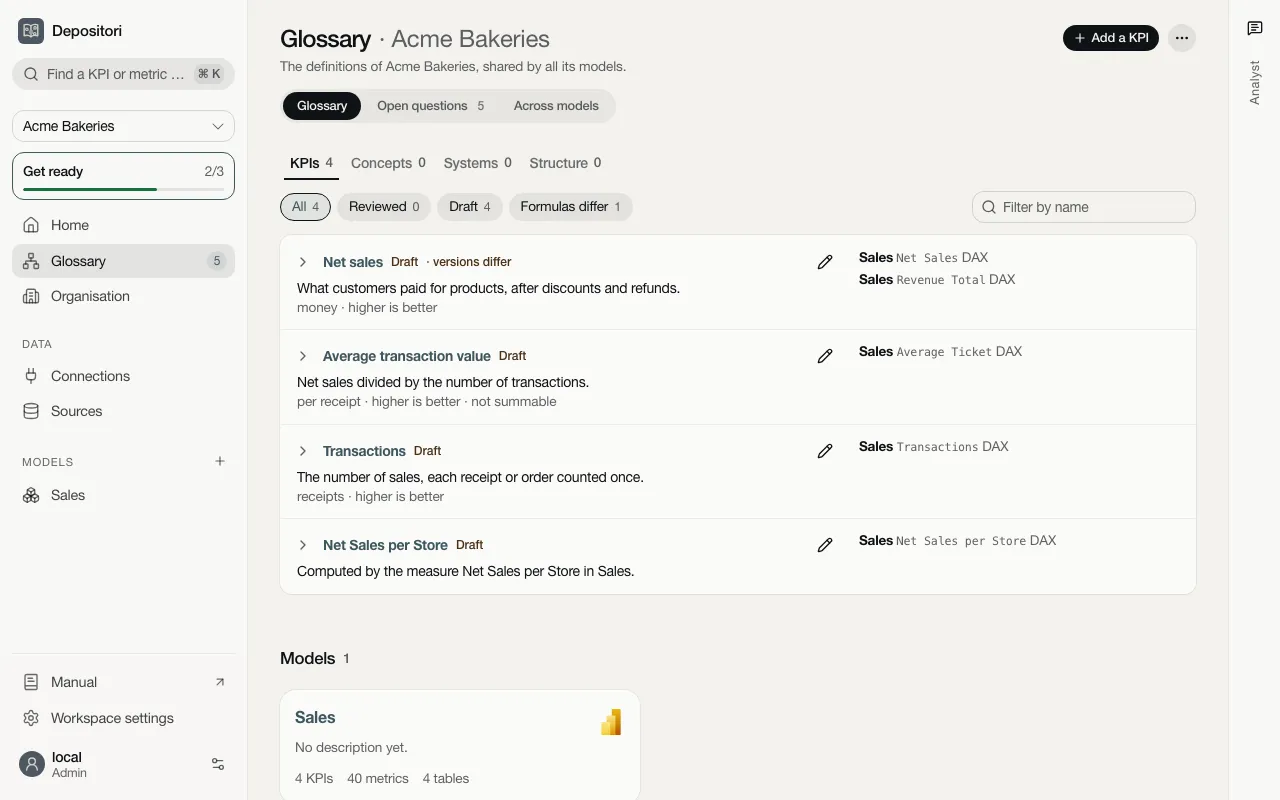
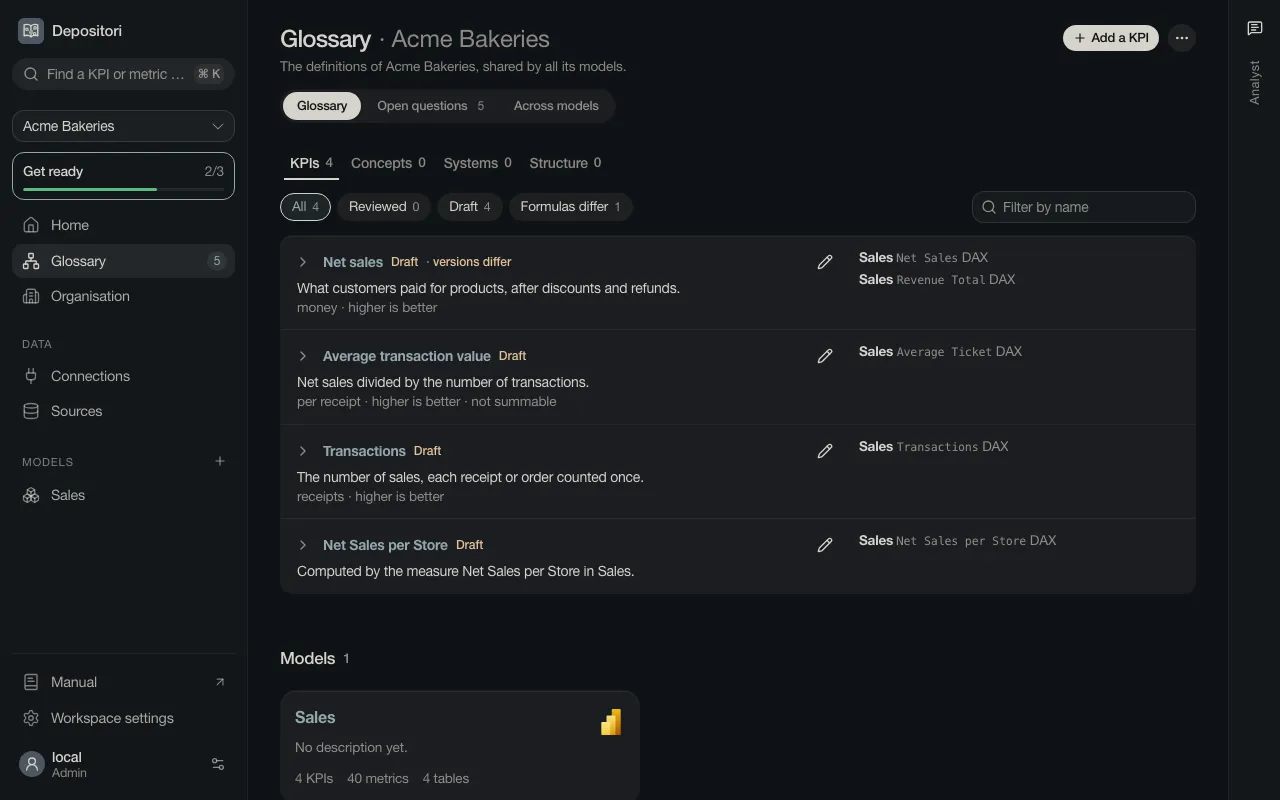
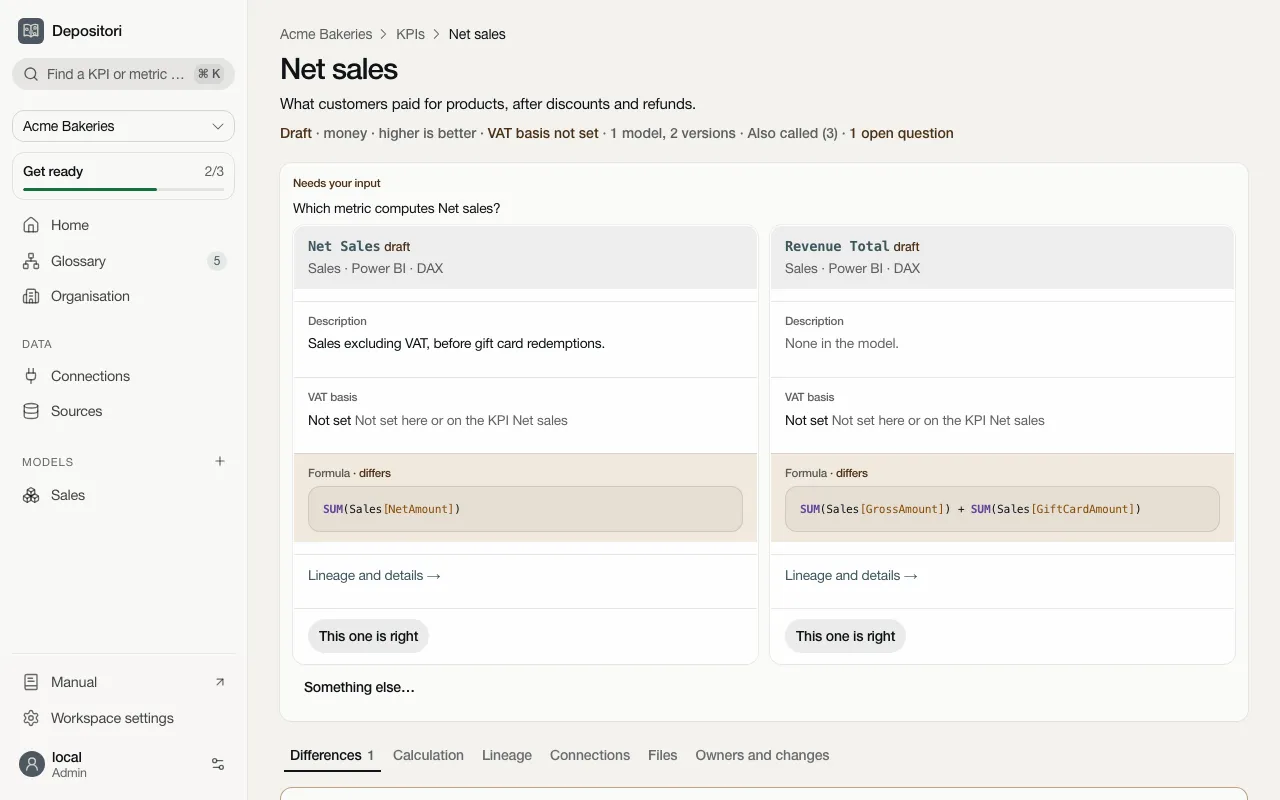
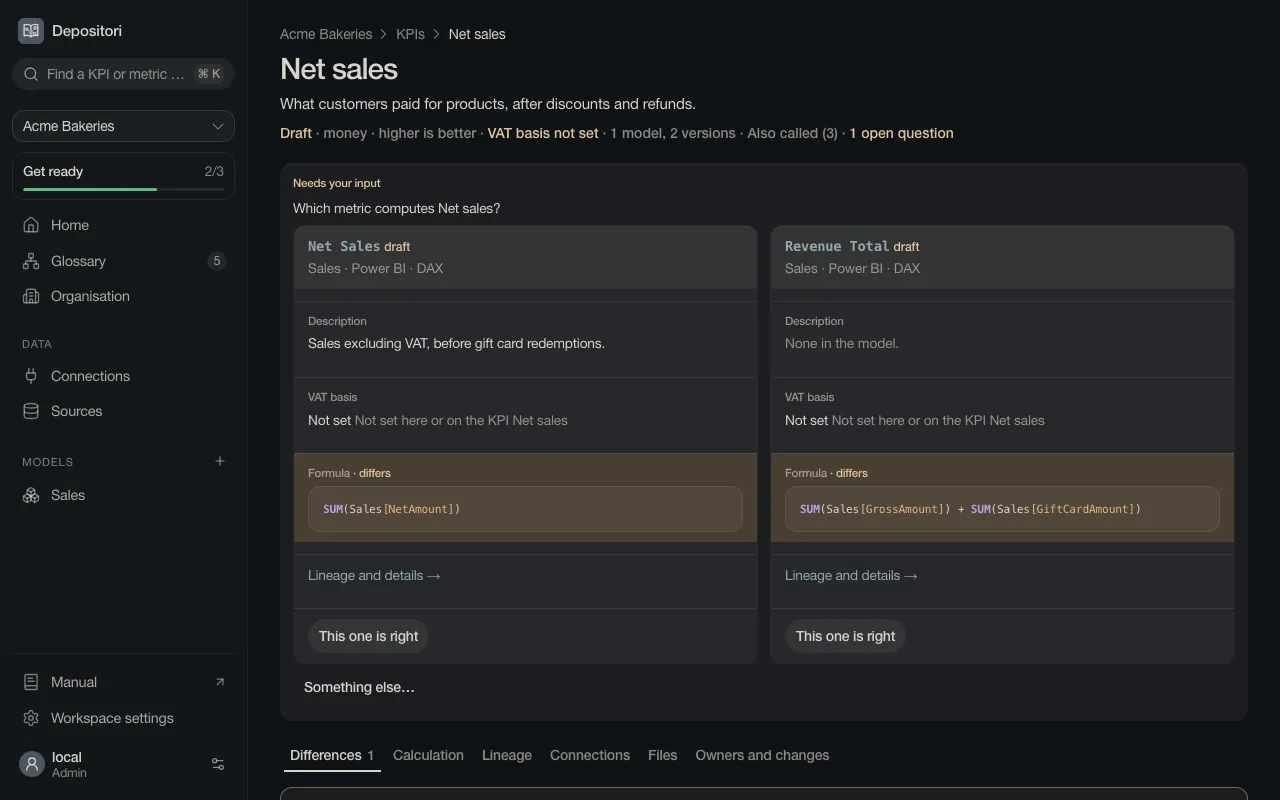
Open a KPI for its page: the definition, how each model calculates it with where they differ, the lineage and the open questions.
A KPI stays a Draft until someone reviews it. Contributors and up change one with the pencil on its row or on its page, or add one with Add a KPI.
Open questions
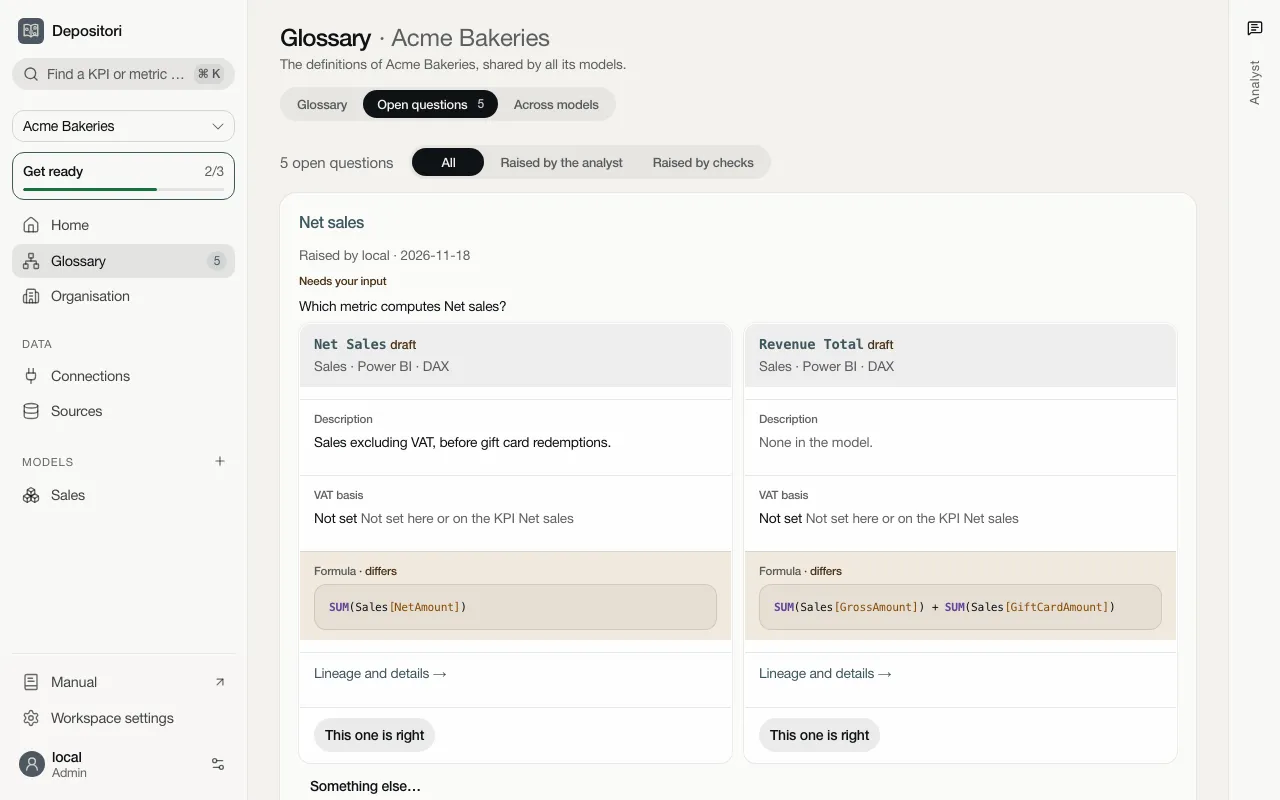
Section titled “Open questions”Depositori collects what it could not decide: which of two metrics calculates a KPI, whether an amount includes VAT, how your weeks are numbered. Answer them on Glossary, Open questions. The number next to Glossary in the sidebar is how many are open.
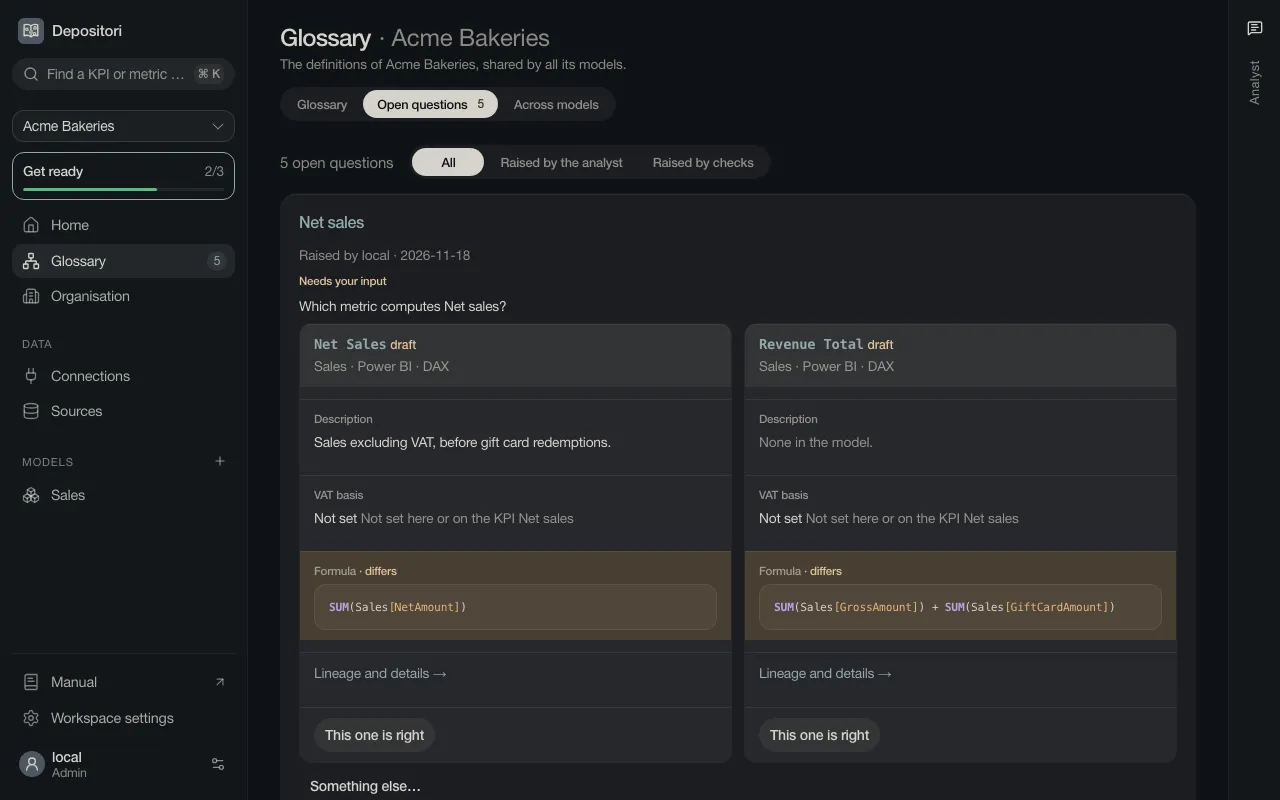
When the models calculate a KPI differently, the question shows each calculation side by side, as on the KPI’s Calculation tab: the metric and model, the description, the VAT basis and the formula, with the parts that differ marked. Press Confirm on the calculation that should count. Readers see the same cards without the buttons.
Find a KPI
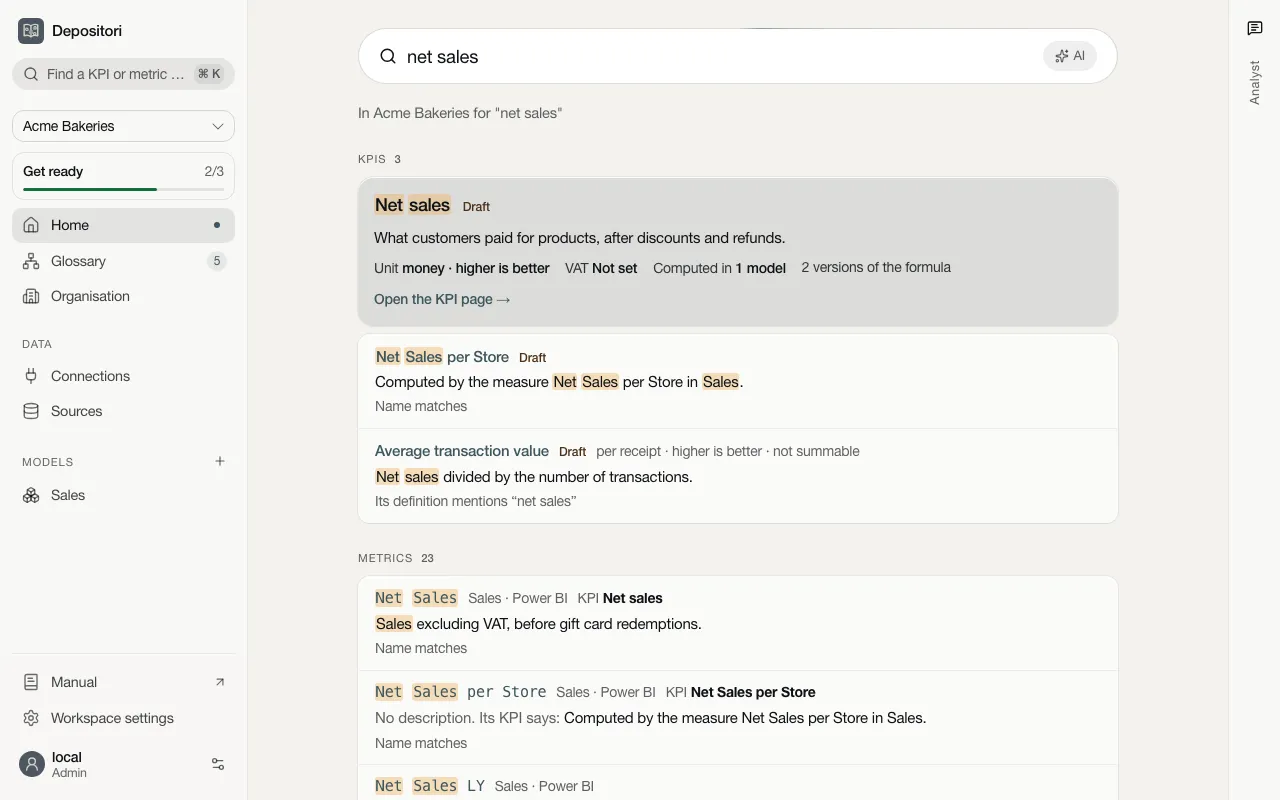
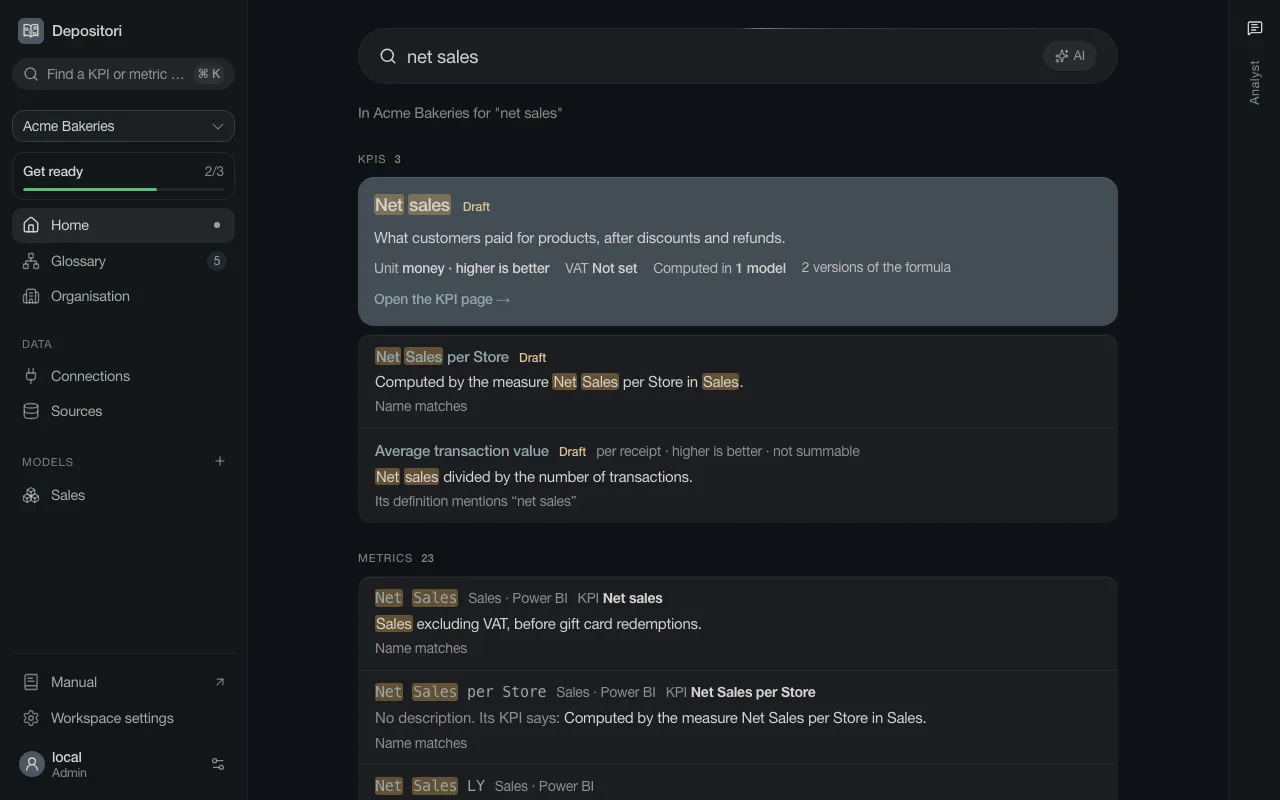
Section titled “Find a KPI”Type a business word in the search box at the top left, or on Home. KPIs come first, then the metrics that calculate them, then the tables. Every result says why it matched.